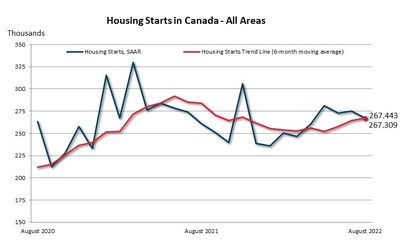
OTTAWA, ON, Sept. 16, 2022 /CNW/ – The standalone monthly seasonally adjusted annual rate (SAAR) of total housing starts for all areas in Canada in August was 267,443 units, down 3% from July. The SAAR of total urban starts decreased 3% to 246,771 units in August. Multi-unit urban starts declined 4% to 187,602 units, while single-detached urban starts increased 1% to 59,169 units.
Rural starts were estimated at a seasonally adjusted annual rate of 20,672 units.
“The six-month trend in housing starts was higher in August compared to July, despite a lower monthly SAAR. Housing starts activity remains elevated in Canada historically and have been well above 200,000 units since 2020,” said Bob Dugan, CMHC’s Chief Economist. “The decline in monthly SAAR housing starts in Canada’s urban areas in August was driven by lower multi-unit starts. A decline in single-detached units in Vancouver was offset by higher multi-unit starts. Toronto posted strong increases across the board, while Montreal recorded a large (33%) decline in multi-unit starts, resulting in the overall decline for Canada.“
The trend in housing starts was 267,309 units in August, up from 264,467 units in July, according to Canada Mortgage and Housing Corporation (CMHC). This trend measure is a six-month moving average of the monthly seasonally adjusted annual rates (SAAR) of housing starts.
CMHC uses the trend measure as a complement to the monthly SAAR of housing starts to account for considerable swings in monthly estimates and obtain a clearer picture of upcoming new housing supply. In some situations, analyzing only SAAR data can be misleading, as the multi-unit segment largely drives the market and can vary significantly from one month to the next.Key Facts:
- Monthly Housing Starts and Other Construction Data are accessible in English and French on our website and the CMHC Housing Market Information Portal.
- Housing starts data is available on the eleventh business day each month. We will release the September data on October 18 at 8:15 AM ET.
- Definitions and methodology to better understand the foundations of the Starts and Completions and Market Absorption surveys.
As a trusted source of housing information, CMHC provides unbiased housing-related data, research and market information to help close knowledge gaps, and deepen understanding of complex housing issues to inform future policy decisions. Housing starts facilitate the analysis of monthly, quarterly and year-over-year activity in the new home market. The data we collect as part of our Starts and Completions and Market Absorption surveys helps us obtain a clearer picture of upcoming new housing supply and is used as part of our various housing reports.
For more information, follow us on Twitter, YouTube, LinkedIn, Facebook and Instagram.Related Links:
- The road ahead for the economy and housing
- Understanding Canada’s housing supply shortages
- Household projections for Canada’s major urban centres
| Housing Start Data in Centres 10,000 Population and Over | |||||||||
| Single-Detached | All Others | Total | |||||||
| August 2021 | August 2022 | % | August 2021 | August 2022 | % | August 2021 | August 2022 | % | |
| Provinces (10,000+) | |||||||||
| N.-L. | 57 | 76 | 33 | 3 | 14 | 367 | 60 | 90 | 50 |
| P.E.I. | 31 | 16 | -48 | 37 | 49 | 32 | 68 | 65 | -4 |
| N.S. | 119 | 103 | -13 | 49 | 257 | 424 | 168 | 360 | 114 |
| N.B. | 108 | 157 | 45 | 204 | 379 | 86 | 312 | 536 | 72 |
| Atlantic | 315 | 352 | 12 | 293 | 699 | 139 | 608 | 1,051 | 73 |
| Qc | 498 | 533 | 7 | 2,517 | 2,644 | 5 | 3,015 | 3,177 | 5 |
| Ont. | 2,564 | 2,409 | -6 | 6,430 | 6,534 | 2 | 8,994 | 8,943 | -1 |
| Man. | 254 | 244 | -4 | 303 | 269 | -11 | 557 | 513 | -8 |
| Sask. | 133 | 118 | -11 | 34 | 317 | ## | 167 | 435 | 160 |
| Alta. | 1,234 | 1,312 | 6 | 1,408 | 1,495 | 6 | 2,642 | 2,807 | 6 |
| Prairies | 1,621 | 1,674 | 3 | 1,745 | 2,081 | 19 | 3,366 | 3,755 | 12 |
| B.C. | 642 | 586 | -9 | 2,911 | 3,231 | 11 | 3,553 | 3,817 | 7 |
| Canada (10,000+) | 5,640 | 5,554 | -2 | 13,896 | 15,189 | 9 | 19,536 | 20,743 | 6 |
| Metropolitan Areas | |||||||||
| Abbotsford-Mission | 23 | 38 | 65 | 26 | 18 | -31 | 49 | 56 | 14 |
| Barrie | 89 | 165 | 85 | 248 | 68 | -73 | 337 | 233 | -31 |
| Belleville | 45 | 28 | -38 | 50 | 15 | -70 | 95 | 43 | -55 |
| Brantford | 94 | 141 | 50 | 196 | 106 | -46 | 290 | 247 | -15 |
| Calgary | 524 | 510 | -3 | 586 | 672 | 15 | 1,110 | 1,182 | 6 |
| Edmonton | 521 | 586 | 12 | 755 | 533 | -29 | 1,276 | 1,119 | -12 |
| Greater Sudbury | 8 | 32 | 300 | 2 | 36 | ## | 10 | 68 | ## |
| Guelph | 19 | 16 | -16 | 12 | 39 | 225 | 31 | 55 | 77 |
| Halifax | 32 | 47 | 47 | 11 | 219 | ## | 43 | 266 | ## |
| Hamilton | 61 | 89 | 46 | 638 | 82 | -87 | 699 | 171 | -76 |
| Kelowna | 57 | 66 | 16 | 369 | 556 | 51 | 426 | 622 | 46 |
| Kingston | 43 | 16 | -63 | 14 | 104 | ## | 57 | 120 | 111 |
| Kitchener-Cambridge-Waterloo | 86 | 65 | -24 | 384 | 349 | -9 | 470 | 414 | -12 |
| Lethbridge | 27 | 24 | -11 | 21 | 200 | ## | 48 | 224 | 367 |
| London | 201 | 127 | -37 | 209 | 43 | -79 | 410 | 170 | -59 |
| Moncton | 28 | 44 | 57 | 179 | 283 | 58 | 207 | 327 | 58 |
| Montréal | 155 | 114 | -26 | 1,982 | 1,260 | -36 | 2,137 | 1,374 | -36 |
| Oshawa | 137 | 143 | 4 | 146 | 233 | 60 | 283 | 376 | 33 |
| Ottawa-Gatineau | 287 | 290 | 1 | 648 | 1,056 | 63 | 935 | 1,346 | 44 |
| Gatineau | 32 | 81 | 153 | 34 | 8 | -76 | 66 | 89 | 35 |
| Ottawa | 255 | 209 | -18 | 614 | 1,048 | 71 | 869 | 1,257 | 45 |
| Peterborough | 54 | 52 | -4 | 158 | 4 | -97 | 212 | 56 | -74 |
| Québec | 35 | 58 | 66 | 135 | 737 | 446 | 170 | 795 | 368 |
| Regina | 49 | 22 | -55 | 9 | 41 | 356 | 58 | 63 | 9 |
| Saguenay | 49 | 41 | -16 | 19 | 40 | 111 | 68 | 81 | 19 |
| St. Catharines-Niagara | 134 | 117 | -13 | 63 | 115 | 83 | 197 | 232 | 18 |
| Saint John | 29 | 26 | -10 | 2 | 0 | -100 | 31 | 26 | -16 |
| St. John’s | 47 | 68 | 45 | 3 | 14 | 367 | 50 | 82 | 64 |
| Saskatoon | 75 | 87 | 16 | 22 | 269 | ## | 97 | 356 | 267 |
| Sherbrooke | 28 | 35 | 25 | 110 | 86 | -22 | 138 | 121 | -12 |
| Thunder Bay | 10 | 17 | 70 | 0 | 0 | – | 10 | 17 | 70 |
| Toronto | 776 | 689 | -11 | 3,253 | 3,846 | 18 | 4,029 | 4,535 | 13 |
| Trois-Rivières | 22 | 28 | 27 | 6 | 46 | ## | 28 | 74 | 164 |
| Vancouver | 253 | 230 | -9 | 1,650 | 1,729 | 5 | 1,903 | 1,959 | 3 |
| Victoria | 59 | 56 | -5 | 513 | 307 | -40 | 572 | 363 | -37 |
| Windsor | 58 | 76 | 31 | 76 | 167 | 120 | 134 | 243 | 81 |
| Winnipeg | 217 | 207 | -5 | 273 | 226 | -17 | 490 | 433 | -12 |
| Total | 4,332 | 4,350 | 0 | 12,768 | 13,499 | 6 | 17,100 | 17,849 | 4 |
| Data for 2021 and 2022 based on 2016 Census Definitions. | |||||||||
| Source: CMHC Starts and Completion Survey, Market Absorption Survey | |||||||||
| ## not calculable / extreme value | |||||||||
| Housing Start Data – Seasonally Adjusted at Annual Rates (SAAR) | |||||||||
| Single-Detached | All Others | Total | |||||||
| July 2022 | August 2022 | % | July 2022 | August 2022 | % | July 2022 | August 2022 | % | |
| Provinces (10,000+) | |||||||||
| N.L. | 775 | 626 | -19 | 48 | 169 | 252 | 823 | 795 | -3 |
| P.E.I. | 213 | 178 | -16 | 192 | 588 | 206 | 405 | 766 | 89 |
| N.S. | 1,502 | 1,143 | -24 | 5,728 | 3,088 | -46 | 7,230 | 4,231 | -41 |
| N.B. | 908 | 1,216 | 34 | 3,970 | 4,522 | 14 | 4,878 | 5,738 | 18 |
| Qc | 7,219 | 7,835 | 9 | 45,453 | 42,375 | -7 | 52,672 | 50,210 | -5 |
| Ont. | 21,627 | 22,982 | 6 | 70,780 | 73,110 | 3 | 92,407 | 96,092 | 4 |
| Man. | 2,621 | 2,664 | 2 | 3,648 | 3,228 | -12 | 6,269 | 5,892 | -6 |
| Sask. | 1,461 | 1,360 | -7 | 1,572 | 3,804 | 142 | 3,033 | 5,164 | 70 |
| Alta. | 14,887 | 14,515 | -2 | 26,071 | 17,748 | -32 | 40,958 | 32,263 | -21 |
| B.C. | 7,125 | 6,650 | -7 | 38,365 | 38,970 | 2 | 45,490 | 45,620 | 0 |
| Canada (10,000+) | 58,338 | 59,169 | 1 | 195,827 | 187,602 | -4 | 254,165 | 246,771 | -3 |
| Canada (All Areas) | 72,685 | 73,406 | 1 | 202,473 | 194,040 | -4 | 275,158 | 267,443 | -3 |
| Metropolitan Areas | |||||||||
| Abbotsford-Mission | 389 | 446 | 15 | 1,560 | 216 | -86 | 1,949 | 662 | -66 |
| Barrie | 1,532 | 1,252 | -18 | 1,692 | 816 | -52 | 3,224 | 2,068 | -36 |
| Belleville | 195 | 268 | 37 | 60 | 180 | 200 | 255 | 448 | 76 |
| Brantford | 821 | 642 | -22 | 1,320 | 1,272 | -4 | 2,141 | 1,914 | -11 |
| Calgary | 6,154 | 5,767 | -6 | 16,272 | 8,064 | -50 | 22,426 | 13,831 | -38 |
| Edmonton | 6,836 | 6,688 | -2 | 9,024 | 6,396 | -29 | 15,860 | 13,084 | -18 |
| Greater Sudbury | 56 | 184 | 229 | 264 | 432 | 64 | 320 | 616 | 93 |
| Guelph | 135 | 152 | 13 | 204 | 468 | 129 | 339 | 620 | 83 |
| Halifax | 832 | 565 | -32 | 5,004 | 2,628 | -47 | 5,836 | 3,193 | -45 |
| Hamilton | 1,071 | 852 | -20 | 1,236 | 984 | -20 | 2,307 | 1,836 | -20 |
| Kelowna | 652 | 993 | 52 | 480 | 6,672 | ## | 1,132 | 7,665 | ## |
| Kingston | 438 | 188 | -57 | 264 | 1,248 | 373 | 702 | 1,436 | 105 |
| Kitchener-Cambridge-Waterloo | 1,091 | 665 | -39 | 3,660 | 4,188 | 14 | 4,751 | 4,853 | 2 |
| Lethbridge | 269 | 254 | -6 | 108 | 2,400 | ## | 377 | 2,654 | ## |
| London | 895 | 1,435 | 60 | 2,448 | 516 | -79 | 3,343 | 1,951 | -42 |
| Moncton | 350 | 476 | 36 | 2,220 | 3,396 | 53 | 2,570 | 3,872 | 51 |
| Montréal | 1,703 | 1,805 | 6 | 23,160 | 15,404 | -33 | 24,863 | 17,209 | -31 |
| Oshawa | 1,177 | 1,413 | 20 | 2,808 | 2,796 | 0 | 3,985 | 4,209 | 6 |
| Ottawa-Gatineau | 3,024 | 3,225 | 7 | 21,888 | 12,672 | -42 | 24,912 | 15,897 | -36 |
| Gatineau | 718 | 949 | 32 | 3,312 | 96 | -97 | 4,030 | 1,045 | -74 |
| Ottawa | 2,306 | 2,276 | -1 | 18,576 | 12,576 | -32 | 20,882 | 14,852 | -29 |
| Peterborough | 312 | 359 | 15 | 0 | 48 | ## | 312 | 407 | 30 |
| Québec | 964 | 935 | -3 | 6,252 | 8,844 | 41 | 7,216 | 9,779 | 36 |
| Regina | 443 | 233 | -47 | 528 | 492 | -7 | 971 | 725 | -25 |
| Saguenay | 347 | 305 | -12 | 144 | 480 | 233 | 491 | 785 | 60 |
| St. Catharines-Niagara | 1,159 | 1,122 | -3 | 312 | 1,380 | 342 | 1,471 | 2,502 | 70 |
| Saint John | 243 | 260 | 7 | 60 | 0 | -100 | 303 | 260 | -14 |
| St. John’s | 745 | 613 | -18 | 36 | 168 | 367 | 781 | 781 | – |
| Saskatoon | 947 | 1,046 | 10 | 924 | 3,228 | 249 | 1,871 | 4,274 | 128 |
| Sherbrooke | 460 | 584 | 27 | 840 | 1,032 | 23 | 1,300 | 1,616 | 24 |
| Thunder Bay | 153 | 133 | -13 | 228 | 0 | -100 | 381 | 133 | -65 |
| Toronto | 4,801 | 5,737 | 19 | 34,584 | 46,152 | 33 | 39,385 | 51,889 | 32 |
| Trois-Rivières | 209 | 387 | 85 | 792 | 552 | -30 | 1,001 | 939 | -6 |
| Vancouver | 2,881 | 2,517 | -13 | 20,400 | 20,748 | 2 | 23,281 | 23,265 | 0 |
| Victoria | 995 | 854 | -14 | 10,332 | 3,684 | -64 | 11,327 | 4,538 | -60 |
| Windsor | 697 | 756 | 8 | 1,080 | 2,004 | 86 | 1,777 | 2,760 | 55 |
| Winnipeg | 2,224 | 2,254 | 1 | 2,916 | 2,712 | -7 | 5,140 | 4,966 | -3 |
| Data for 2021 and 2022 based on 2016 Census Definitions. | |||||||||
| Source: CMHC Starts and Completion Survey, Market Absorption Survey | |||||||||
| ## not calculable / extreme value |


SOURCE Canada Mortgage and Housing Corporation

Back | Next story: Forte Minerals Appoints Two Strategic Members to the Advisory Committee