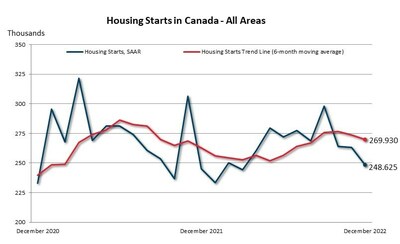
OTTAWA, ON, Jan. 17, 2023 /CNW/ – The standalone monthly SAAR of total housing starts for all areas in Canada declined 5% in December (248,625 units) compared to November (263,022 units) according to Canada Mortgage and Housing Corporation (CMHC). The SAAR of total urban starts also declined 5%, with 227,708 units recorded in December. Multi-unit urban starts decreased 4% to 182,850 units, while single-detached urban starts fell 11% to 44,858 units.

Rural starts were estimated at a seasonally adjusted annual rate of 20,917 units.
The trend in housing starts was 269,930 units in December, down 1% from 273,801 units in November. This trend measure is a six-month moving average of the monthly seasonally adjusted annual rates (SAAR) of housing starts.
“The 2022 year ended with a slight decline for both the monthly SAAR of housing starts and the trend at the national level in December; however, Toronto, Montreal, and Vancouver all posted increases in total SAAR housing starts, with Toronto posting a significant increase of 72% in December. The rate of new construction continued at an elevated pace in 2022 overall, ending the year with actual total urban starts at 240,590 units (-1%) in Canada, similar to levels observed in 2021 (244,141 units). While these additional units will provide much needed supply on the market, demand for housing in the country will continue to grow. We need to find innovative ways to deliver more housing supply and keep building at a higher pace in the coming years in order to improve affordability,” said Bob Dugan, CMHC’s Chief Economist.
Regional Highlights (2022 Actual Starts):
- Housing starts in the Toronto Census Metropolitan Area (CMA) concluded 2022 at 45,109 units, 7.6% higher than in the prior year. This marked the highest level since 2012 (48,105 units) and the fourth highest number on record. The growth in housing starts was entirely attributable to the multi-unit segment (comprised of semi-detached homes, row homes, and apartments). There were 38,780 multi-unit starts in 2022, the largest number on record. The majority of these were apartments, of which most were condominiums.
- The level of housing starts activity in the Montreal CMA was in line with pre-pandemic levels in 2022 with 24,000 housing starts, representing a decrease of 25 % compared to 2021. The level of housing starts in 2021 was nevertheless a 30-year record. The decrease of housing starts was observed across all market types (homeowners, rentals, condos), with rental starts continuing to be the number 1 product built in the CMA, representing 61 % of all housing starts in that market.
- Housing starts in the Vancouver CMA totaled 25,983 units in 2022, unchanged overall from 2021 (26,103 units). Builders are continuing to operate near capacity and at an elevated pace, similar to the past five years. Construction of rental apartments surged due to strong demand. Meanwhile, condominium apartment starts fell as developers took a more cautious approach to the segment. Higher mortgage interest rates are limiting the budgets of homebuyers, shifting some demand from ownership to rental.
Key Facts:
- Monthly Housing Starts and Other Construction Data are accessible in English and French on our website and the CMHC Housing Market Information Portal.
- Housing starts data is available on the eleventh business day each month. We will release the January housing starts data on February 15 at 8:15 AM ET.
- CMHC uses the trend measure as a complement to the monthly SAAR of housing starts to account for considerable swings in monthly estimates and obtain a clearer picture of upcoming new housing supply. In some situations, analyzing only SAAR data can be misleading, as the multi-unit segment largely drives the market and can vary significantly from one month to the next.
- Definitions and methodology to better understand the foundations of the Starts and Completions and Market Absorption surveys.
As a trusted source of housing information, CMHC provides unbiased housing-related data, research, and market information to help close knowledge gaps, and deepen understanding of complex housing issues to inform future policy decisions. Housing starts facilitate the analysis of monthly, quarterly and year-over-year activity in the new home market. The data we collect as part of our Starts and Completions and Market Absorption surveys helps us obtain a clearer picture of upcoming new housing supply and is used as part of our various housing reports.
For more information, follow us on Twitter, YouTube, LinkedIn, Facebook and Instagram.Related Links:
- Overview of residential construction in Canada’s largest CMAs (HSR)
- The road ahead for the economy and housing — fall 2022 update
- Canada’s housing supply shortage: skilled labour capacity
- Understanding Canada’s housing supply shortages
- Household projections for Canada’s major urban centres
Information on this release:
We encourage journalists to contact CMHC Media Relations and arrange to speak to our market analysts regarding the housing starts in their respective Canadian Census Metropolitan Areas (CMAs).
| Housing Start Data in Centres 10,000 Population and Over | |||||||||
| Single-Detached | All Others | Total | |||||||
| December 2021 | December 2022 | % | December 2021 | December 2022 | % | December 2021 | December 2022 | % | |
| Provinces (10,000+) | |||||||||
| N.-L. | 56 | 64 | 14 | 24 | 89 | 271 | 80 | 153 | 91 |
| P.E.I. | 19 | 23 | 21 | 19 | 35 | 84 | 38 | 58 | 53 |
| N.S. | 149 | 123 | -17 | 607 | 272 | -55 | 756 | 395 | -48 |
| N.B. | 79 | 47 | -41 | 266 | 89 | -67 | 345 | 136 | -61 |
| Atlantic | 303 | 257 | -15 | 916 | 485 | -47 | 1,219 | 742 | -39 |
| Qc | 344 | 254 | -26 | 3,274 | 1,757 | -46 | 3,618 | 2,011 | -44 |
| Ont. | 1,870 | 1,427 | -24 | 3,576 | 6,927 | 94 | 5,446 | 8,354 | 53 |
| Man. | 187 | 107 | -43 | 374 | 321 | -14 | 561 | 428 | -24 |
| Sask. | 125 | 61 | -51 | 128 | 181 | 41 | 253 | 242 | -4 |
| Alta. | 1,104 | 856 | -22 | 1,398 | 1,263 | -10 | 2,502 | 2,119 | -15 |
| Prairies | 1,416 | 1,024 | -28 | 1,900 | 1,765 | -7 | 3,316 | 2,789 | -16 |
| B.C. | 679 | 511 | -25 | 3,519 | 3,939 | 12 | 4,198 | 4,450 | 6 |
| Canada (10,000+) | 4,612 | 3,473 | -25 | 13,185 | 14,873 | 13 | 17,797 | 18,346 | 3 |
| Metropolitan Areas | |||||||||
| Abbotsford-Mission | 18 | 21 | 17 | 165 | 113 | -32 | 183 | 134 | -27 |
| Barrie | 90 | 27 | -70 | 62 | 71 | 15 | 152 | 98 | -36 |
| Belleville | 25 | 13 | -48 | 8 | 5 | -38 | 33 | 18 | -45 |
| Brantford | 153 | 65 | -58 | 2 | 33 | ## | 155 | 98 | -37 |
| Calgary | 473 | 410 | -13 | 682 | 670 | -2 | 1,155 | 1,080 | -6 |
| Edmonton | 445 | 310 | -30 | 615 | 464 | -25 | 1,060 | 774 | -27 |
| Greater Sudbury | 8 | 19 | 138 | 4 | 19 | 375 | 12 | 38 | 217 |
| Guelph | 8 | 3 | -63 | 32 | 13 | -59 | 40 | 16 | -60 |
| Halifax | 86 | 56 | -35 | 495 | 196 | -60 | 581 | 252 | -57 |
| Hamilton | 41 | 60 | 46 | 261 | 83 | -68 | 302 | 143 | -53 |
| Kelowna | 106 | 54 | -49 | 457 | 337 | -26 | 563 | 391 | -31 |
| Kingston | 28 | 3 | -89 | 17 | 0 | -100 | 45 | 3 | -93 |
| Kitchener-Cambridge-Waterloo | 78 | 39 | -50 | 449 | 630 | 40 | 527 | 669 | 27 |
| Lethbridge | 27 | 15 | -44 | 16 | 39 | 144 | 43 | 54 | 26 |
| London | 159 | 66 | -58 | 106 | 140 | 32 | 265 | 206 | -22 |
| Moncton | 17 | 16 | -6 | 141 | 41 | -71 | 158 | 57 | -64 |
| Montréal | 104 | 62 | -40 | 1,756 | 914 | -48 | 1,860 | 976 | -48 |
| Oshawa | 33 | 25 | -24 | 19 | 44 | 132 | 52 | 69 | 33 |
| Ottawa-Gatineau | 223 | 116 | -48 | 170 | 201 | 18 | 393 | 317 | -19 |
| Gatineau | 17 | 1 | -94 | 11 | 0 | -100 | 28 | 1 | -96 |
| Ottawa | 206 | 115 | -44 | 159 | 201 | 26 | 365 | 316 | -13 |
| Peterborough | 39 | 11 | -72 | 0 | 0 | – | 39 | 11 | -72 |
| Québec | 50 | 45 | -10 | 605 | 303 | -50 | 655 | 348 | -47 |
| Regina | 33 | 14 | -58 | 56 | 33 | -41 | 89 | 47 | -47 |
| Saguenay | 10 | 2 | -80 | 30 | 2 | -93 | 40 | 4 | -90 |
| St. Catharines-Niagara | 62 | 92 | 48 | 101 | 141 | 40 | 163 | 233 | 43 |
| Saint John | 28 | 15 | -46 | 60 | 0 | -100 | 88 | 15 | -83 |
| St. John’s | 52 | 61 | 17 | 24 | 88 | 267 | 76 | 149 | 96 |
| Saskatoon | 85 | 41 | -52 | 64 | 129 | 102 | 149 | 170 | 14 |
| Sherbrooke | 17 | 19 | 12 | 260 | 86 | -67 | 277 | 105 | -62 |
| Thunder Bay | 11 | 4 | -64 | 0 | 0 | – | 11 | 4 | -64 |
| Toronto | 461 | 565 | 23 | 1,944 | 5,287 | 172 | 2,405 | 5,852 | 143 |
| Trois-Rivières | 12 | 10 | -17 | 131 | 115 | -12 | 143 | 125 | -13 |
| Vancouver | 222 | 256 | 15 | 1,963 | 2,869 | 46 | 2,185 | 3,125 | 43 |
| Victoria | 92 | 40 | -57 | 545 | 230 | -58 | 637 | 270 | -58 |
| Windsor | 32 | 38 | 19 | 72 | 17 | -76 | 104 | 55 | -47 |
| Winnipeg | 149 | 88 | -41 | 333 | 269 | -19 | 482 | 357 | -26 |
| Total | 3,477 | 2,681 | -23 | 11,645 | 13,582 | 17 | 15,122 | 16,263 | 8 |
| Data for 2021 and 2022 based on 2016 Census Definitions. | |||||||||
| Source: CMHC Starts and Completion Survey, Market Absorption Survey | |||||||||
| ## not calculable / extreme value | |||||||||
| Housing Start Data – Seasonally Adjusted at Annual Rates (SAAR) | |||||||||
| Single-Detached | All Others | Total | |||||||
| November 2022 | December 2022 | % | November 2022 | December 2022 | % | November 2022 | December 2022 | % | |
| Provinces (10,000+) | |||||||||
| N.L. | 318 | 626 | 97 | 42 | 1,164 | ## | 360 | 1,790 | 397 |
| P.E.I. | 224 | 302 | 35 | 1,008 | 420 | -58 | 1,232 | 722 | -41 |
| N.S. | 1,430 | 1,349 | -6 | 2,430 | 3,258 | 34 | 3,860 | 4,607 | 19 |
| N.B. | 899 | 596 | -34 | 6,663 | 1,074 | -84 | 7,562 | 1,670 | -78 |
| Qc | 5,362 | 3,581 | -33 | 36,283 | 23,071 | -36 | 41,645 | 26,652 | -36 |
| Ont. | 21,331 | 18,356 | -14 | 75,998 | 85,207 | 12 | 97,329 | 103,563 | 6 |
| Man. | 2,320 | 1,444 | -38 | 8,052 | 3,852 | -52 | 10,372 | 5,296 | -49 |
| Sask. | 1,100 | 706 | -36 | 1,368 | 2,172 | 59 | 2,468 | 2,878 | 17 |
| Alta. | 10,356 | 10,690 | 3 | 20,495 | 15,259 | -26 | 30,851 | 25,949 | -16 |
| B.C. | 7,020 | 7,208 | 3 | 37,864 | 47,373 | 25 | 44,884 | 54,581 | 22 |
| Canada (10,000+) | 50,360 | 44,858 | -11 | 190,203 | 182,850 | -4 | 240,563 | 227,708 | -5 |
| Canada (All Areas) | 65,294 | 58,536 | -10 | 197,727 | 190,089 | -4 | 263,022 | 248,625 | -5 |
| Metropolitan Areas | |||||||||
| Abbotsford-Mission | 439 | 282 | -36 | 264 | 1,356 | 414 | 703 | 1,638 | 133 |
| Barrie | 582 | 431 | -26 | 5,880 | 852 | -86 | 6,462 | 1,283 | -80 |
| Belleville | 260 | 179 | -31 | 48 | 60 | 25 | 308 | 239 | -22 |
| Brantford | 849 | 1,213 | 43 | 1,236 | 396 | -68 | 2,085 | 1,609 | -23 |
| Calgary | 3,896 | 4,865 | 25 | 16,092 | 8,040 | -50 | 19,988 | 12,905 | -35 |
| Edmonton | 5,107 | 4,014 | -21 | 3,528 | 5,568 | 58 | 8,635 | 9,582 | 11 |
| Greater Sudbury | 43 | 291 | ## | 144 | 228 | 58 | 187 | 519 | 178 |
| Guelph | 100 | 54 | -46 | 480 | 156 | -68 | 580 | 210 | -64 |
| Halifax | 647 | 629 | -3 | 1,704 | 2,352 | 38 | 2,351 | 2,981 | 27 |
| Hamilton | 670 | 954 | 42 | 10,092 | 996 | -90 | 10,762 | 1,950 | -82 |
| Kelowna | 447 | 514 | 15 | 2,940 | 4,044 | 38 | 3,387 | 4,558 | 35 |
| Kingston | 109 | 37 | -66 | 72 | 0 | -100 | 181 | 37 | -80 |
| Kitchener-Cambridge-Waterloo | 1,204 | 502 | -58 | 11,040 | 7,560 | -32 | 12,244 | 8,062 | -34 |
| Lethbridge | 149 | 181 | 21 | 84 | 468 | 457 | 233 | 649 | 179 |
| London | 1,122 | 894 | -20 | 2,580 | 1,680 | -35 | 3,702 | 2,574 | -30 |
| Moncton | 230 | 255 | 11 | 3,636 | 492 | -86 | 3,866 | 747 | -81 |
| Montréal | 1,343 | 1,122 | -16 | 10,475 | 10,930 | 4 | 11,818 | 12,052 | 2 |
| Oshawa | 938 | 562 | -40 | 4,536 | 528 | -88 | 5,474 | 1,090 | -80 |
| Ottawa-Gatineau | 2,693 | 1,635 | -39 | 11,964 | 2,412 | -80 | 14,657 | 4,047 | -72 |
| Gatineau | 665 | 13 | -98 | 7,908 | 0 | -100 | 8,573 | 13 | -100 |
| Ottawa | 2,028 | 1,622 | -20 | 4,056 | 2,412 | -41 | 6,084 | 4,034 | -34 |
| Peterborough | 281 | 170 | -40 | 0 | 0 | – | 281 | 170 | -40 |
| Québec | 1,045 | 826 | -21 | 11,100 | 3,636 | -67 | 12,145 | 4,462 | -63 |
| Regina | 219 | 168 | -23 | 348 | 396 | 14 | 567 | 564 | -1 |
| Saguenay | 226 | 32 | -86 | 96 | 24 | -75 | 322 | 56 | -83 |
| St. Catharines-Niagara | 1,415 | 1,106 | -22 | 1,272 | 1,692 | 33 | 2,687 | 2,798 | 4 |
| Saint John | 251 | 173 | -31 | 1,548 | 0 | -100 | 1,799 | 173 | -90 |
| St. John’s | 284 | 567 | 100 | 24 | 1,056 | ## | 308 | 1,623 | 427 |
| Saskatoon | 799 | 496 | -38 | 792 | 1,548 | 95 | 1,591 | 2,044 | 28 |
| Sherbrooke | 334 | 254 | -24 | 2,292 | 1,032 | -55 | 2,626 | 1,286 | -51 |
| Thunder Bay | 112 | 70 | -38 | 24 | 0 | -100 | 136 | 70 | -49 |
| Toronto | 7,736 | 8,066 | 4 | 33,756 | 63,444 | 88 | 41,492 | 71,510 | 72 |
| Trois-Rivières | 170 | 213 | 25 | 516 | 1,380 | 167 | 686 | 1,593 | 132 |
| Vancouver | 4,051 | 3,630 | -10 | 23,976 | 34,428 | 44 | 28,027 | 38,058 | 36 |
| Victoria | 586 | 535 | -9 | 6,696 | 2,760 | -59 | 7,282 | 3,295 | -55 |
| Windsor | 537 | 497 | -7 | 948 | 204 | -78 | 1,485 | 701 | -53 |
| Winnipeg | 2,155 | 1,250 | -42 | 6,996 | 3,228 | -54 | 9,151 | 4,478 | -51 |
| Data for 2021 and 2022 based on 2016 Census Definitions. | |||||||||
| Source: CMHC Starts and Completion Survey, Market Absorption Survey | |||||||||
| ## not calculable / extreme value |

SOURCE Canada Mortgage and Housing Corporation

Back | Next story: JESMOND CAPITAL ANNOUNCES AGREEMENT TO COMPLETE A QUALIFYING TRANSACTION WITH QUATTRO ENERGY LIMITED TO BECOME NORTH SEA FOCUSED OIL AND GAS EXPLORATION AND DEVELOPMENT COMPANY