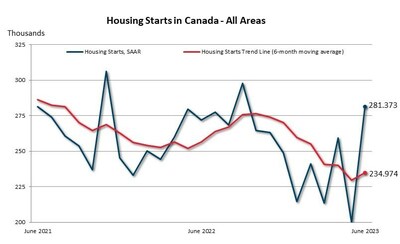
OTTAWA, ON, July 18, 2023 /CNW/ – The declining trend in housing starts observed over the last several months reversed slightly due to a significant increase in actual housing starts in June. The trend was 234,974 units in June, up 2.4% from 229,520 units in May, according to Canada Mortgage and Housing Corporation (CMHC). The trend measure is a six-month moving average of the monthly SAAR of total housing starts for all areas in Canada.
The standalone monthly seasonally adjusted annual rate (SAAR) of total housing starts for all areas in Canada increased 41% in June (281,373 units) compared to May (200,018 units), which represents the largest month to month SAAR change in the last 10 years. This is mostly due to multi-unit starts which accounted for about 82% of total starts.
The monthly SAAR of total urban starts (centres 10,000 population and over) increased 46%, with 262,815 units recorded in June. Multi-unit urban starts increased 59% to 219,914 units, while single-detached urban starts increased 3% to 42,901 units.
The Vancouver and Toronto CMAs recorded significant increases in total SAAR housing starts in June, with Vancouver up 71%, and Toronto up 100%. Toronto and Vancouver’s total housing starts combined accounted for 47% of total housing starts in Canada’s urban centres for the month of June. Montreal CMA also recorded an increase in total SAAR housing starts, however, it was less pronounced at 8%. All three recorded increases in both single-detached and multi-unit starts.
The rural starts monthly SAAR estimate was 18,558 units.
Quote:
“We observed a large increase in the SAAR of housing starts in June which pushed the trend of housing starts upward after consecutive monthly declines since November 2022. Despite this, total year-to-date housing starts for the first half of the year were 8% lower than they were over the same period in 2022 as the high interest rate environment continues to challenge housing starts through increasing borrowing costs,” said Bob Dugan, CMHC’s Chief Economist.Key Facts:
- Toronto and Vancouver have been doing considerably well this year compared to last. Actual 2023 year-to-date housing starts were 32% and 49% higher than the same period in 2022 in Toronto and Vancouver respectively.
- Monthly Housing Starts and Other Construction Data are accessible in English and French on our website and the CMHC Housing Market Information Portal.
- Housing starts data is available on the eleventh business day each month. We will release the July housing starts data on August 16 at 8:15 AM ET.
- CMHC uses the trend measure as a complement to the monthly SAAR of housing starts to account for considerable swings in monthly estimates and obtain a clearer picture of upcoming new housing supply. In some situations, analyzing only SAAR data can be misleading, as the multi-unit segment largely drives the market and can vary significantly from one month to the next.
- Definitions and methodology to better understand the foundations of the Starts and Completions and Market Absorption surveys.
As a trusted source of housing information, CMHC provides unbiased housing-related data, research, and market information to help close knowledge gaps, and deepen understanding of complex housing issues to inform future policy decisions. Housing starts facilitate the analysis of monthly, quarterly, and year-over-year activity in the new home market. The data we collect as part of our Starts and Completions and Market Absorption surveys helps us obtain a clearer picture of upcoming new housing supply and is used as part of our various housing reports.
For more information, visit our website at https://www.cmhc-schl.gc.ca/en, and follow us on Twitter, YouTube, LinkedIn, Facebook and Instagram.Related Links:
- Spring 2023 Housing Market Outlook
- Latest Housing Supply Report (HSR)
- Housing Supply Report (HSR) — Fall Edition
- The road ahead for the economy and housing — fall 2022 update
- Canada’s housing supply shortage: skilled labour capacity
- Understanding Canada’s housing supply shortages
| Housing Start Data in Centres 10,000 Population and Over | |||||||||
| Single-Detached | All Others | Total | |||||||
| June 2022 | June 2023 | % | June 2022 | June 2023 | % | June 2022 | June 2023 | % | |
| Provinces (10,000+) | |||||||||
| N.-L. | 83 | 54 | -35 | 5 | 5 | – | 88 | 59 | -33 |
| P.E.I. | 16 | 13 | -19 | 52 | 10 | -81 | 68 | 23 | -66 |
| N.S. | 167 | 201 | 20 | 282 | 923 | 227 | 449 | 1,124 | 150 |
| N.B. | 133 | 145 | 9 | 356 | 254 | -29 | 489 | 399 | -18 |
| Atlantic | 399 | 413 | 4 | 695 | 1,192 | 72 | 1,094 | 1,605 | 47 |
| Qc | 898 | 454 | -49 | 4,301 | 2,443 | -43 | 5,199 | 2,897 | -44 |
| Ont. | 2,123 | 1,491 | -30 | 6,139 | 8,623 | 40 | 8,262 | 10,114 | 22 |
| Man. | 245 | 153 | -38 | 413 | 434 | 5 | 658 | 587 | -11 |
| Sask. | 131 | 89 | -32 | 430 | 483 | 12 | 561 | 572 | 2 |
| Alta. | 1,558 | 1,149 | -26 | 1,787 | 1,219 | -32 | 3,345 | 2,368 | -29 |
| Prairies | 1,934 | 1,391 | -28 | 2,630 | 2,136 | -19 | 4,564 | 3,527 | -23 |
| B.C. | 656 | 599 | -9 | 3,837 | 4,776 | 24 | 4,493 | 5,375 | 20 |
| Canada (10,000+) | 6,010 | 4,348 | -28 | 17,602 | 19,170 | 9 | 23,612 | 23,518 | 0 |
| Metropolitan Areas | |||||||||
| Abbotsford-Mission | 41 | 18 | -56 | 127 | 53 | -58 | 168 | 71 | -58 |
| Barrie | 107 | 103 | -4 | 197 | 363 | 84 | 304 | 466 | 53 |
| Belleville – Quinte West | 37 | 24 | -35 | 8 | 32 | 300 | 45 | 56 | 24 |
| Brantford | 22 | 53 | 141 | 162 | 2 | -99 | 184 | 55 | -70 |
| Calgary | 551 | 518 | -6 | 1,332 | 721 | -46 | 1,883 | 1,239 | -34 |
| Chilliwack | 17 | 20 | 18 | 12 | 14 | 17 | 29 | 34 | 17 |
| Drummondville | 36 | 14 | -61 | 84 | 27 | -68 | 120 | 41 | -66 |
| Edmonton | 765 | 503 | -34 | 342 | 457 | 34 | 1,107 | 960 | -13 |
| Fredericton | 53 | 61 | 15 | 123 | 81 | -34 | 176 | 142 | -19 |
| Greater/Grand Sudbury | 10 | 2 | -80 | 4 | 2 | -50 | 14 | 4 | -71 |
| Guelph | 39 | 5 | -87 | 55 | 136 | 147 | 94 | 141 | 50 |
| Halifax | 119 | 98 | -18 | 271 | 887 | 227 | 390 | 985 | 153 |
| Hamilton | 85 | 33 | -61 | 307 | 288 | -6 | 392 | 321 | -18 |
| Kamloops | 6 | 5 | -17 | 8 | 1 | -88 | 14 | 6 | -57 |
| Kelowna | 74 | 62 | -16 | 657 | 322 | -51 | 731 | 384 | -47 |
| Kingston | 34 | 27 | -21 | 26 | 0 | -100 | 60 | 27 | -55 |
| Kitchener-Cambridge-Waterloo | 165 | 109 | -34 | 376 | 54 | -86 | 541 | 163 | -70 |
| Lethbridge | 32 | 26 | -19 | 7 | 2 | -71 | 39 | 28 | -28 |
| London | 156 | 27 | -83 | 80 | 214 | 168 | 236 | 241 | 2 |
| Moncton | 38 | 38 | – | 229 | 164 | -28 | 267 | 202 | -24 |
| Montréal | 280 | 134 | -52 | 2,830 | 774 | -73 | 3,110 | 908 | -71 |
| Nanaimo | 23 | 16 | -30 | 25 | 3 | -88 | 48 | 19 | -60 |
| Oshawa | 112 | 115 | 3 | 205 | 60 | -71 | 317 | 175 | -45 |
| Ottawa-Gatineau | 258 | 236 | -9 | 639 | 792 | 24 | 897 | 1,028 | 15 |
| Gatineau | 27 | 14 | -48 | 105 | 413 | 293 | 132 | 427 | 223 |
| Ottawa | 231 | 222 | -4 | 534 | 379 | -29 | 765 | 601 | -21 |
| Peterborough | 39 | 3 | -92 | 0 | 0 | – | 39 | 3 | -92 |
| Québec | 97 | 37 | -62 | 590 | 540 | -8 | 687 | 577 | -16 |
| Red Deer | 20 | 3 | -85 | 8 | 4 | -50 | 28 | 7 | -75 |
| Regina | 42 | 10 | -76 | 45 | 149 | 231 | 87 | 159 | 83 |
| Saguenay | 25 | 34 | 36 | 36 | 14 | -61 | 61 | 48 | -21 |
| St. Catharines-Niagara | 105 | 41 | -61 | 40 | 132 | 230 | 145 | 173 | 19 |
| Saint John | 34 | 31 | -9 | 2 | 0 | -100 | 36 | 31 | -14 |
| St. John’s | 73 | 50 | -32 | 4 | 5 | 25 | 77 | 55 | -29 |
| Saskatoon | 81 | 75 | -7 | 384 | 333 | -13 | 465 | 408 | -12 |
| Sherbrooke | 47 | 27 | -43 | 67 | 71 | 6 | 114 | 98 | -14 |
| Thunder Bay | 16 | 16 | – | 40 | 4 | -90 | 56 | 20 | -64 |
| Toronto | 466 | 370 | -21 | 3,780 | 6,801 | 80 | 4,246 | 7,171 | 69 |
| Trois-Rivières | 45 | 10 | -78 | 97 | 267 | 175 | 142 | 277 | 95 |
| Vancouver | 296 | 350 | 18 | 2,446 | 3,555 | 45 | 2,742 | 3,905 | 42 |
| Victoria | 46 | 25 | -46 | 187 | 477 | 155 | 233 | 502 | 115 |
| Windsor | 73 | 31 | -58 | 66 | 25 | -62 | 139 | 56 | -60 |
| Winnipeg | 215 | 139 | -35 | 319 | 428 | 34 | 534 | 567 | 6 |
| Total | 4,780 | 3,499 | -27 | 16,217 | 18,254 | 13 | 20,997 | 21,753 | 4 |
| Data for 2022 based on 2016 Census Definitions and data for 2023 based on 2021 Census Definitions. | |||||||||
| Source: CMHC | |||||||||
| ## not calculable / extreme value |
| Housing Start Data – Seasonally Adjusted at Annual Rates (SAAR) | |||||||||
| Single-Detached | All Others | Total | |||||||
| May 2023 | June 2023 | % | May 2023 | June 2023 | % | May 2023 | June 2023 | % | |
| Provinces (10,000+) | |||||||||
| N.L. | 316 | 418 | 32 | 23 | 50 | 117 | 339 | 468 | 38 |
| P.E.I. | 38 | 142 | 274 | 108 | 120 | 11 | 146 | 262 | 79 |
| N.S. | 1,680 | 2,227 | 33 | 3,127 | 11,138 | 256 | 4,807 | 13,365 | 178 |
| N.B. | 828 | 1,023 | 24 | 2,909 | 2,982 | 3 | 3,737 | 4,005 | 7 |
| Qc | 3,519 | 3,498 | -1 | 17,790 | 21,551 | 21 | 21,309 | 25,049 | 18 |
| Ont. | 15,094 | 15,452 | 2 | 51,468 | 101,342 | 97 | 66,562 | 116,794 | 75 |
| Man. | 1,673 | 1,554 | -7 | 5,136 | 5,208 | 1 | 6,809 | 6,762 | -1 |
| Sask. | 830 | 942 | 13 | 1,308 | 5,796 | 343 | 2,138 | 6,738 | 215 |
| Alta. | 11,524 | 11,243 | -2 | 24,279 | 14,486 | -40 | 35,803 | 25,729 | -28 |
| B.C. | 6,246 | 6,402 | 2 | 32,467 | 57,241 | 76 | 38,713 | 63,643 | 64 |
| Canada (10,000+) | 41,748 | 42,901 | 3 | 138,615 | 219,914 | 59 | 180,363 | 262,815 | 46 |
| Canada (All Areas) | 54,740 | 55,552 | 1 | 145,276 | 225,817 | 55 | 200,018 | 281,373 | 41 |
| Metropolitan Areas | |||||||||
| Abbotsford-Mission | 266 | 203 | -24 | 1,884 | 636 | -66 | 2,150 | 839 | -61 |
| Barrie | 1,041 | 1,236 | 19 | 432 | 4,356 | ## | 1,473 | 5,592 | 280 |
| Belleville – Quinte West | 158 | 195 | 23 | 48 | 384 | ## | 206 | 579 | 181 |
| Brantford | 631 | 1,281 | 103 | 756 | 24 | -97 | 1,387 | 1,305 | -6 |
| Calgary | 5,660 | 5,654 | 0 | 18,768 | 8,652 | -54 | 24,428 | 14,306 | -41 |
| Chilliwack | 224 | 282 | 26 | 224 | 168 | -25 | 932 | 450 | -52 |
| Drummondville | 114 | 119 | 4 | 540 | 324 | -40 | 654 | 443 | -32 |
| Edmonton | 4,682 | 4,710 | 1 | 5,220 | 5,484 | 5 | 9,902 | 10,194 | 3 |
| Fredericton | 110 | 399 | 263 | 264 | 972 | 268 | 374 | 1,371 | 267 |
| Greater/Grand Sudbury | 90 | 20 | -78 | 120 | 24 | -80 | 210 | 44 | -79 |
| Guelph | 65 | 41 | -37 | 60 | 1,632 | ## | 125 | 1,673 | ## |
| Halifax | 343 | 675 | 97 | 1,728 | 10,644 | ## | 2,071 | 11,319 | 447 |
| Hamilton | 261 | 310 | 19 | 756 | 3,456 | 357 | 1,017 | 3,766 | 270 |
| Kamloops | 59 | 57 | -3 | 36 | 12 | -67 | 95 | 69 | -27 |
| Kelowna | 403 | 534 | 33 | 1,440 | 3,864 | 168 | 1,843 | 4,398 | 139 |
| Kingston | 266 | 240 | -10 | 108 | 0 | -100 | 374 | 240 | -36 |
| Kitchener-Cambridge-Waterloo | 800 | 1,173 | 47 | 1,704 | 648 | -62 | 2,504 | 1,821 | -27 |
| Lethbridge | 12 | 222 | ## | 0 | 24 | ## | 12 | 246 | ## |
| London | 431 | 336 | -22 | 2,388 | 2,568 | 8 | 2,819 | 2,904 | 3 |
| Moncton | 209 | 263 | 26 | 1,824 | 1,968 | 8 | 2,033 | 2,231 | 10 |
| Montréal | 857 | 1,088 | 27 | 8,511 | 9,053 | 6 | 9,368 | 10,141 | 8 |
| Nanaimo | 190 | 169 | -11 | 552 | 36 | -93 | 742 | 205 | -72 |
| Oshawa | 377 | 1,076 | 185 | 1,512 | 720 | -52 | 1,889 | 1,796 | -5 |
| Ottawa-Gatineau | 1,604 | 2,581 | 61 | 3,216 | 9,504 | 196 | 4,820 | 12,085 | 151 |
| Gatineau | 291 | 304 | 4 | 900 | 4,956 | 451 | 1,191 | 5,260 | 342 |
| Ottawa | 1,313 | 2,277 | 73 | 2,316 | 4,548 | 96 | 3,629 | 6,825 | 88 |
| Peterborough | 51 | 33 | -35 | 120 | 0 | -100 | 171 | 33 | -81 |
| Québec | 437 | 347 | -21 | 2,916 | 6,480 | 122 | 3,353 | 6,827 | 104 |
| Red Deer | 125 | 40 | -68 | 216 | 48 | -78 | 341 | 88 | -74 |
| Regina | 170 | 90 | -47 | 288 | 1,788 | ## | 458 | 1,878 | 310 |
| Saguenay | 109 | 206 | 89 | 288 | 168 | -42 | 397 | 374 | -6 |
| St. Catharines-Niagara | 1,517 | 516 | -66 | 984 | 1,584 | 61 | 2,501 | 2,100 | -16 |
| Saint John | 209 | 253 | 21 | 960 | 0 | -100 | 1,169 | 253 | -78 |
| St. John’s | 303 | 365 | 20 | 72 | 60 | -17 | 375 | 425 | 13 |
| Saskatoon | 558 | 758 | 36 | 1,008 | 3,996 | 296 | 1,566 | 4,754 | 204 |
| Sherbrooke | 188 | 187 | -1 | 864 | 852 | -1 | 1,052 | 1,039 | -1 |
| Thunder Bay | 81 | 102 | 26 | 0 | 48 | ## | 81 | 150 | 85 |
| Toronto | 4,132 | 4,162 | 1 | 38,724 | 81,612 | 111 | 42,856 | 85,774 | 100 |
| Trois-Rivières | 149 | 70 | -53 | 612 | 3,204 | 424 | 761 | 3,274 | 330 |
| Vancouver | 3,428 | 3,638 | 6 | 23,724 | 42,660 | 80 | 27,152 | 46,298 | 71 |
| Victoria | 637 | 227 | -64 | 996 | 5,724 | 475 | 1,633 | 5,951 | 264 |
| Windsor | 260 | 230 | -12 | 528 | 300 | -43 | 788 | 530 | -33 |
| Winnipeg | 1,556 | 1,402 | -10 | 5,076 | 5,136 | 1 | 6,632 | 6,538 | -1 |
| Data for 2022 based on 2016 Census Definitions and data for 2023 based on 2021 Census Definitions. | |||||||||
| Source: CMHC | |||||||||
| ## not calculable / extreme value |


SOURCE Canada Mortgage and Housing Corporation

Back | Next story: Baylin Technologies Announces Expansion into European Market with Growing Demand for its Patented Multibeam Antennas